

The stock market is a complicated domain, especially if you are a beginner. It often looks intimidating and chaotic, which makes it an uncharted territory for beginners. However, underneath the scary-looking graphs and price fluctuations, there are a lot of patterns that you can read, and when you learn how to read those patterns, you can improve your probability of anticipating where the market may move next.
These patterns provide valuable insights into trends, momentum, reversal signals and the key components of stock market graphs, which we will be discussing in this article.
Trend Patterns
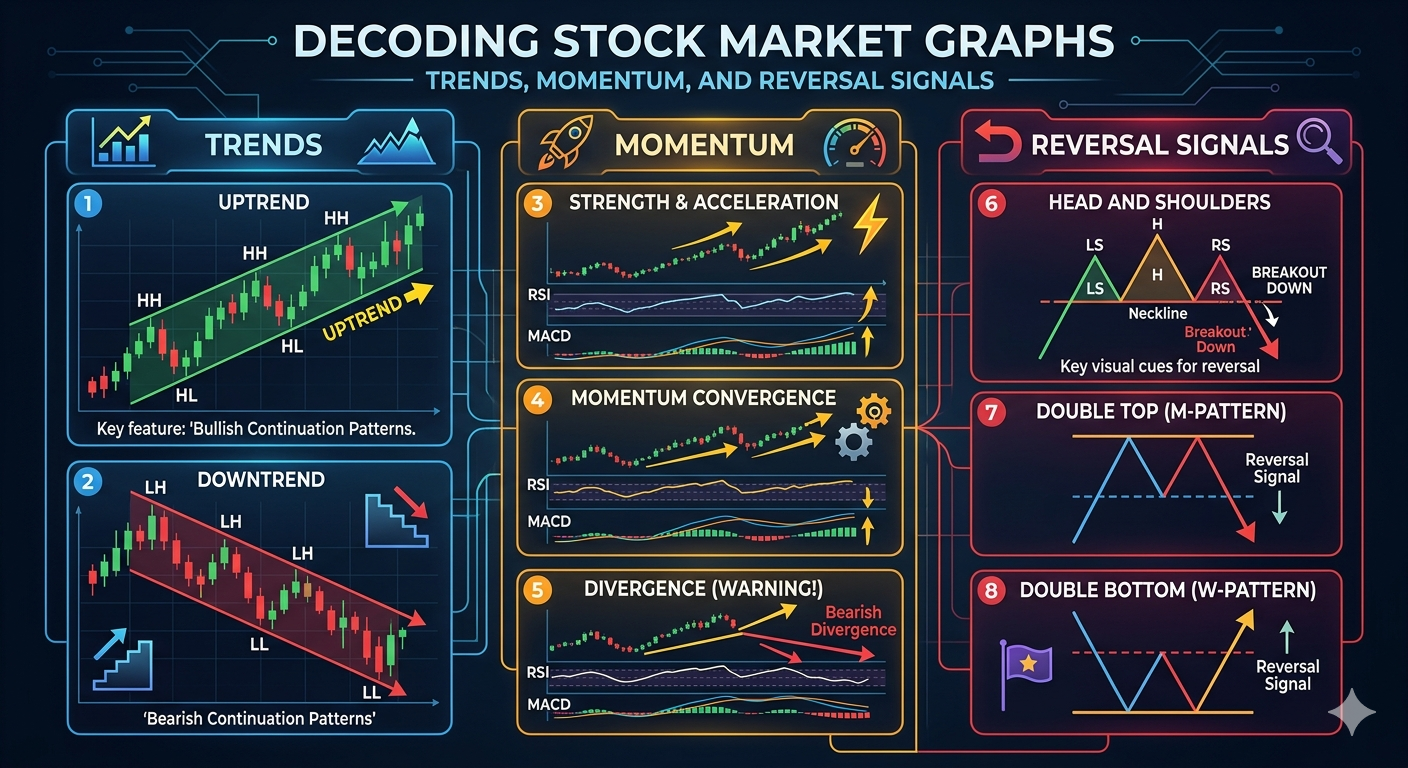
Let us first start with one of the most important component of stock market graphs: Trends, also called Trend Patterns. They reveal the prevailing direction, a.k.a which way the graph is presently moving, which helps you understand the current direction of price movement.
- Uptrends: Uptrends are when there is a recurring pattern of higher highs and higher lows in the graph. It generally happens during a bullish market when demand outweighs supply.
- Flags and Pennants: These patterns are short-term and generally look like small triangles or rectangles. Flags and pennants are continuation patterns that appear during both uptrends and downtrends, signalling that the prior trend may resume after a short pause.
- Downtrends: This is the exact opposite of uptrends, where lower lows and lower highs happen, and it generally happens during during bearish conditions where supply exceeds demand.
- Ascending Triangles: It features a horizontal resistance line and an ascending support line, and it often suggests increasing buying pressure and the possibility of an upside breakout.
- Descending Triangles: These triangles feature a horizontal support line and a descending resistance line, often signalling increasing selling pressure and the possibility of a downside breakout.
- Sideways Trends (Consolidation): When prices increase or decrease within a horizontal straight range, going neither high nor low, it signifies a consolidation phase in the market.
- Rectangles: This means that there is a period of equilibrium between buyers and sellers, and the demand and supply have matched perfectly with each other.
Reversal Patterns
As we know, the market is unpredictable, and it doesn’t matter whether the trend will go up or down by chance; when buying or selling pressure weakens significantly, trends can reverse direction, and it is called trend reversal. The reversal patterns are:
| Pattern Name | What It Looks Like | What It Means |
| Head and Shoulders | Looks like a head in the middle with two smaller peaks (shoulders) on each side | It usually means the price was going up, but now it may start going down. |
| Inverse Head and Shoulders | Looks like an upside-down head and shoulders | It usually means the price was going down, but now it may start going up. |
| Double Top | Two peaks at almost the same price level | The price tried to go higher twice but failed, so it may start falling. |
| Double Bottom | Two dips at almost the same price level | The price tried to go lower twice but failed, so it may start rising. |
| Triple Top | Three peaks at nearly the same level | The price failed three times to move higher, so a downward move may follow. |
| Triple Bottom | Three dips at nearly the same level | The price failed three times to move lower, so an upward move may follow. |
| Rounding Top | A slow, curved shape at the top | The price is slowly losing strength and may start falling. |
| Rounding Bottom | A slow, curved shape at the bottom | The price is slowly gaining strength and may start rising. |
Momentum
Momentum looks at how fast prices are changing, not what the prices are at the moment. To quantify momentum, you measure price changes over a defined period. To make a momentum line for 10 days, you would take the last closing price and subtract the closing price from 10 days ago. Then, this result is plotted around a line that is zero. If the momentum number is over zero, prices are going up; if it is below zero, prices are going down.
- You need to look at the history of the momentum line and draw horizontal lines at its upper and lower borders because the Momentum indicator doesn’t have an upper and lower boundary. When the momentum line reaches extreme historical levels, it may suggest that the stock is overextended and due for a pullback.
- If momentum crosses above the zero line, it can indicate strengthening upward movement. If it crosses below the zero line while it is going down, that is a sell short signal. When using these signals, traders usually go with the flow of the overall trend.
- If the underlying prices reach a new high or low that the Momentum Indicator doesn’t confirm, the divergence could mean that the price is about to change direction.
The calculation formula for the Momentum of the stock market is:
- Momentum = Price today – Price n periods ago
where n represents the selected time period from when you plan to calculate the momentum from.
How Knowing These Graph Components Can Give You An Advantage
Understanding trends, momentum and reversal signals gives gives you an analytical advantage in your decision-making in the stock market during your stock market analysis, and here’s why that’s the case.
You Stop Trading Emotionally
You don’t shoot arrows in the dark anymore. Once you learn how to read the components in stock market graphs, you are able to make more informed trading decisions without getting over excited or panicking.
You Improve Entry and Exit Timing
You don’t randomly buy and sell anymore; you can now enter when the market breaks out, and exit when the market nears resistance levels. The best part? You can avoid false moves during consolidation.
Conclusion
Understanding the stock market graphs and their components, like trends, momentum and reversal signals, gives you a big edge in your stock market analysis. You stop trading emotionally, and the cherry on top is that the stock market doesn’t look like a dark, scary abyss, as it once looked like.